Overview
The Monthly Subscription Dashboard in Bobok provides schools with a centralized control panel to monitor subscription activity, revenue, and commission analytics in real time.
This dashboard enables school administrators to:
Track subscription revenue
Monitor active plans
View cancellations and refunds
Analyze commission earned
Export financial data for reporting
1. Accessing the Dashboard
Log in to your Bobok School Admin Panel.
Navigate to Dashboard
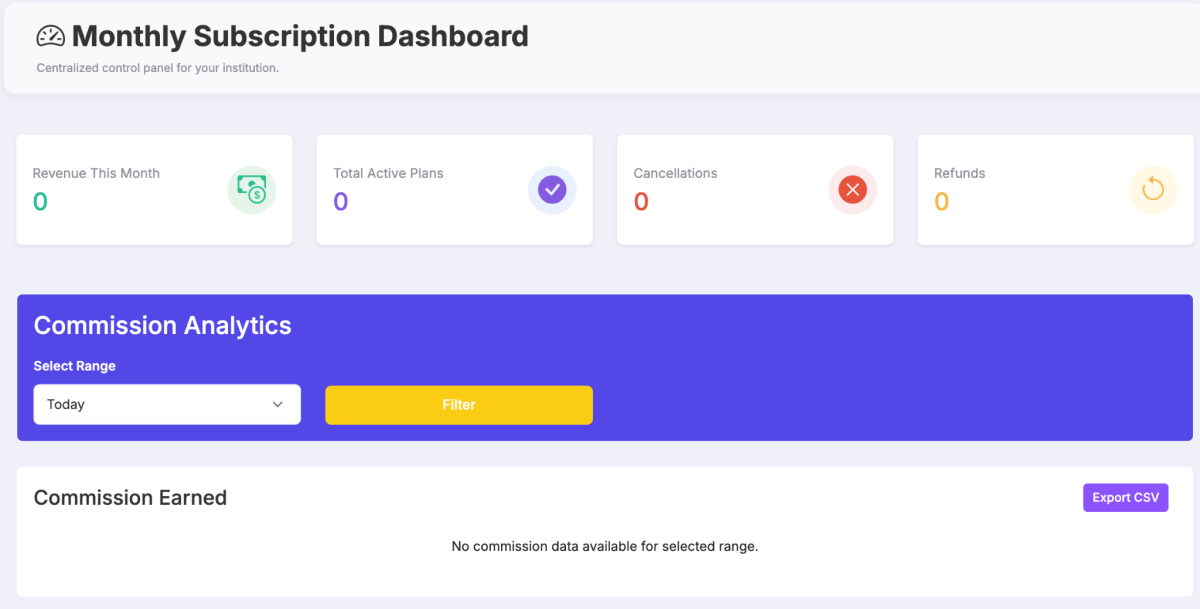
You will see Monthly Subscription Dashboard followed by commission analytics.
The dashboard opens with summary metrics and commission analytics.
2. Dashboard Summary Cards
At the top of the page, you will see four key performance indicators (KPIs):
2.1 Revenue This Month
Displays total subscription revenue collected for the current month.
Use Case:
Monitor cash flow from subscriptions
Compare monthly growth
2.2 Total Active Plans
Shows the total number of currently active subscription plans.
Use Case:
Track current subscriber base
Monitor retention performance
2.3 Cancellations
Indicates how many subscription plans were cancelled during the selected period.
Use Case:
Identify churn rate
Investigate retention issues
2.4 Refunds
Displays the total number of refunded subscriptions.
Use Case:
Monitor refund trends
Detect billing or service issues
3. Commission Analytics Section
This section provides filtered insights into commissions earned from subscriptions.
3.1 Select Range
The dropdown allows you to filter commission data by time range.
Typical options include:
Today
This Week
This Month
Custom Date Range
After selecting a range:
Choose the desired time filter.
Click Filter.
The system updates the commission data accordingly.
4. Commission Earned
This section displays commission details based on the selected time range.
If no data exists for the selected range, the message displayed will be:
“No commission data available for selected range.”
5. Export CSV
The Export CSV button allows administrators to download commission data for reporting and accounting purposes.
Steps to Export:
Select the desired date range.
Click Filter.
Click Export CSV.
A CSV file will download containing:
Date
Plan details
Subscription amount
Commission amount
Status
Use Case:
Share financial reports with management
Upload to accounting software
Maintain audit records
6. How Schools Should Use This Dashboard Strategically
To maximize performance:
Weekly Review
Monitor new subscriptions
Track cancellations
Evaluate refund frequency
Monthly Review
Compare revenue growth
Calculate churn rate
Analyze commission trends
Red Flags to Watch
High cancellations in short time
Increasing refund numbers
Stagnant active plan growth
7. Best Practices
Review dashboard every Monday morning.
Export CSV at month-end for accounting.
Investigate cancellations within 48 hours.
Track performance trends for at least 3 consecutive months before making pricing decisions.
8. Troubleshooting
No Data Showing
Ensure correct date range is selected.
Click Filter after changing range.
Confirm subscription plans are active in the system.
Incorrect Revenue Display
Verify subscription plan pricing.
Check if refunds were processed.
Confirm payment gateway status.
Conclusion
The Dashboard provides schools with full visibility over subscription revenue and commission tracking. Regular monitoring ensures better financial control, improved retention strategy, and accurate reporting.